In this post we’ll learn about key tips on Customizing Debugging Window View in Visual Studio. Let’s check. We’ll Use code>DebuggerBrowsable attribute to customize the debugging windows. Let’s use DebuggerDisplay attribute to customize the debugging display (refer #2).


To use above attributes, you have to use System.Diagnostics namesapce
1. Using DebuggerBrowsable Attributes
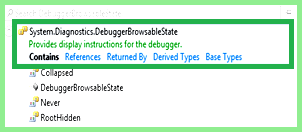
If you want to customize the debugger window display for properties while debugging, you can easily do this using the DebuggerBrowsable property. You can apply these attributes to all properties, fields, or indexers. The DebuggerBrowsable property constructor takes DebuggerBrowsableState as an argument. DebuggerBrowsableState is used to provide the debugger with instructions on how it should be displayed in the debugger window.
We can provide three states for DebuggerBrowsable attributes.
1. Collapsed : If we set DebuggerBrowsableState as collapsed, then debugger window will show the element as collapsed. it’s the default behavior.

2. Never: It will never show the element in debugging window.
3. RootHidden: It will hide the root elements and display the all-child items as expanded view.
Now we will demonstrate how to use these DebuggerBrowsable and DebuggerBrowsableState properties with an example. Before we begin, consider that we have the following block of code.
namespace DebuggerDemo
{
class Program
{
static void Main(string[] args)
{
List<Student> student = new List<Student>();
student.Add(new Student { Roll = 1, Name = "Abhijit", Marks = 87, Addresses = new Address { Address1 = "add1", Address2 = "add2" } });
student.Add(new Student { Roll = 2, Name = "Abhishek", Marks = 41, Addresses = new Address { Address1 = "add3", Address2 = "add4" } });
student.Add(new Student { Roll = 3, Name = "Rahul", Marks = 67, Addresses = new Address { Address1 = "add5", Address2 = "" } });
student.Add(new Student { Roll = 4, Name = "Sunil", Marks = 91, Addresses = new Address { Address1 = "add11", Address2 = "add122" } });
student.Add(new Student { Roll = 5, Name = "Atul", Marks = 71, Addresses = new Address { Address1 = "add12", Address2 = "add222" } });
student.Add(new Student { Roll = 6, Name = "Kunal", Marks = 71, Addresses = new Address { Address1 = "add12", Address2 = "add222" } });
}
}
class Student
{

public int Roll { get; set; }
public string Name { get; set; }
public int Marks { get; set; }
public Address Addresses { get; set; }
}

class Address
{
public string Address1 { get; set; }
public string Address2 { get; set; }
}
}
You can read the full definition of these DebuggerBrowsableStates on MSDN
Now let’s see how the normal debug window works. Just put a breakpoint at the end of the main method and try to explore the debug window, you will get the debug window as shown in the image below, which is the expected view of the debug window.

In the image above, you can see we have 6 student objects and each object has a different value. Since addresses are a different class and are used as multi-valued attributes, they are in compact mode.
Now I want to see all the addresses as well as all other attributes in expanded mode and I also want to hide the brand attributes. To meet the above requirement, we need to add a DebuggerBrowsable attribute to the Marks and addresses properties in the student class.

Now if you put the breakpoint in the same location and explore the debugging window you will find the debugging window view as below picture.

So, from the above picture you can easily identify the changes in the debugging window view.
2. Use DebuggerDisplay attribute
This is the second piece of advice. By using the DebuggerDisplay property, you can determine how a class or field is displayed in the debugger window. Using DebuggerDisplay you can change the debugger window messages and variables you want to display.
If you look at the sample code above and debug the application, by default you will get the debug snapshot below.
Must read:

Here for each student object you get NameSpace.ClassName as default display message. We can now customize the display using the DebuggerDisplay property. The DebuggerDisplay property constructors take the display name as an argument, or you can pass a named parameter that you want to display there.

After making the above changes, if you run the same code, you will find this custom display message with the appropriate parameter value you provided in the debugger’s display properties.

Important Note:
When using DebuggerDisplay, you need to ensure that you provide the correct field name as an argument in { }. Otherwise you will receive a message like below.

In this article, we have explained how we can customize the debug window view while debugging our application using DebuggerBrowsable and DebuggerDisplay properties. This is very useful when you are debugging a complex object and want to make your debug window very simple.
I hope above will help. You can check more articles on our website under C# section HERE or you can also check same on Microsoft Docs too.
